Is Rural America Failing or Succeeding? Maybe Both

The following article was originally published on the University of New Hampshire Carsey School of Public Policy’s website on September 8, 2020. You can view the original article here: https://carsey.unh.edu/publication/rural-america-failing-or-succeeding.
Commentators often lament the decline of rural America by contrasting the substantial population gains in urban areas to the modest gains in rural areas and the diminishing share of the population that lives there.1 The nonmetropolitan (rural) population peaked in 1940, when 75 million people, or 57 percent of all Americans, lived in small towns, in the open countryside, or on farms. Today, only 46 million people reside in nonmetropolitan areas, a record low 14 percent of the population. Many assume that a constant tide of the rural population has been flowing into cities, but the shift is not so simple. The spatial boundaries that separate rural and urban America are highly fluid.
This brief summarizes our peer reviewed article in Demography2 that provides cautionary lessons regarding the commonplace narrative of widespread rural decline and urban growth. It highlights the demographic fact that many counties simply “grow up” to become metropolitan. Each decade, many of the most successful nonmetropolitan counties—those with the greatest population and economic gains—are redefined as metropolitan. Today, 71 million people reside in the 753 counties that were once nonmetropolitan but since 1970 have been reclassified as metropolitan. With so many growing nonmetropolitan counties shifting to metropolitan status each decade due to urbanization, it is little wonder that rural population gains lag behind those in urban areas.
After Each Census There Are Fewer Nonmetropolitan Counties
The Office of Management and Budget (OMB) is charged with classifying counties as metropolitan or nonmetropolitan. Metropolitan areas include one or more central counties containing an urban nucleus with 50,000 or more people, together with contiguous outlying counties that are economically integrated with the metropolitan core through commuting patterns. Counties not meeting the definition of metropolitan are classified as nonmetropolitan. After each decennial census, OMB reconsiders the classifications, and counties with an urban center that has gained enough population to exceed the 50,000 threshold or ones that are on the periphery of an expanding metropolitan area are reclassified from nonmetropolitan to metropolitan. Almost by definition, this shifts many fast growing counties from the nonmetropolitan to the metropolitan side of the ledger. In contrast, most slow-growing or declining rural counties remain classified as nonmetropolitan. Over the past 50 years, OMB has reclassified 753 counties—nearly 25 percent of all counties—from nonmetropolitan to metropolitan.3
Reclassification has been geographically widespread but is more evident in the South and West and less so in the Great Plains and New England (Figure 1).
Figure 1. Counties by Metropolitan Status
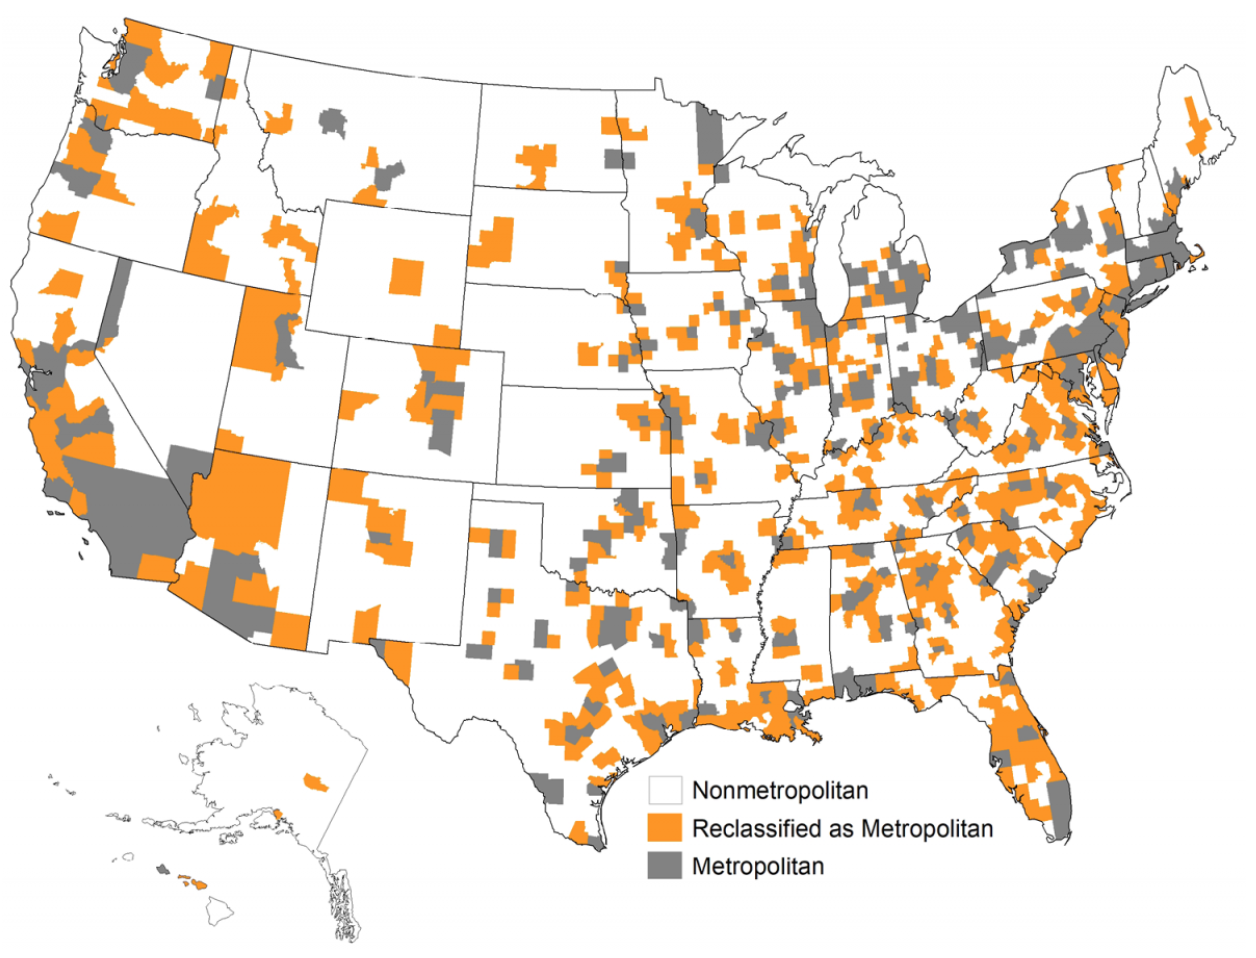
Source: K. M. Johnson and D. T. Lichter, Demography (2020)
Many reclassified counties (in orange) have been added to the periphery of established metropolitan regions, while others represent entirely new metropolitan areas. The urbanization that underlays this reclassification of 753 counties has shifted 71 million residents from nonmetropolitan to metropolitan America (Figure 2). By 2019, 22 percent of the U.S. population resided in counties that had been reclassified from nonmetropolitan to metropolitan since 1970. All of the growth in the metropolitan percentage of the U.S. population—from 67 percent in 1970 to 86 percent in 2019—was due to the growth and reclassification of nonmetropolitan counties. Without this reclassification, by 2019 the share of the U.S. population residing in the 419 counties classified as metropolitan in 1970 would have declined to 64 percent.
The cumulative impact of reclassification on the share of the population that is metropolitan has been substantial in each of the last five decades. Counties that transitioned to metropolitan status in the past 50 years grew at the highest rate due to a substantial net migration gain and significant natural increase (Figure 3). In contrast, natural increase accounted for most, but not all, of the modest population gains in the other two groups. Counties that remained nonmetropolitan generally grew at the lowest rate. Continuously metropolitan counties grew more than counties that remained nonmetropolitan, but far less than the counties that were reclassified. Thus, the share of the population that was metropolitan grew not because of endogenous population increase in the original metropolitan areas of 1970 but because many fast-growing counties were being subtracted from the nonmetropolitan side of the ledger and added to the metropolitan side.
Figure 2. Counties and Population by Metropolitan Classification, 2019
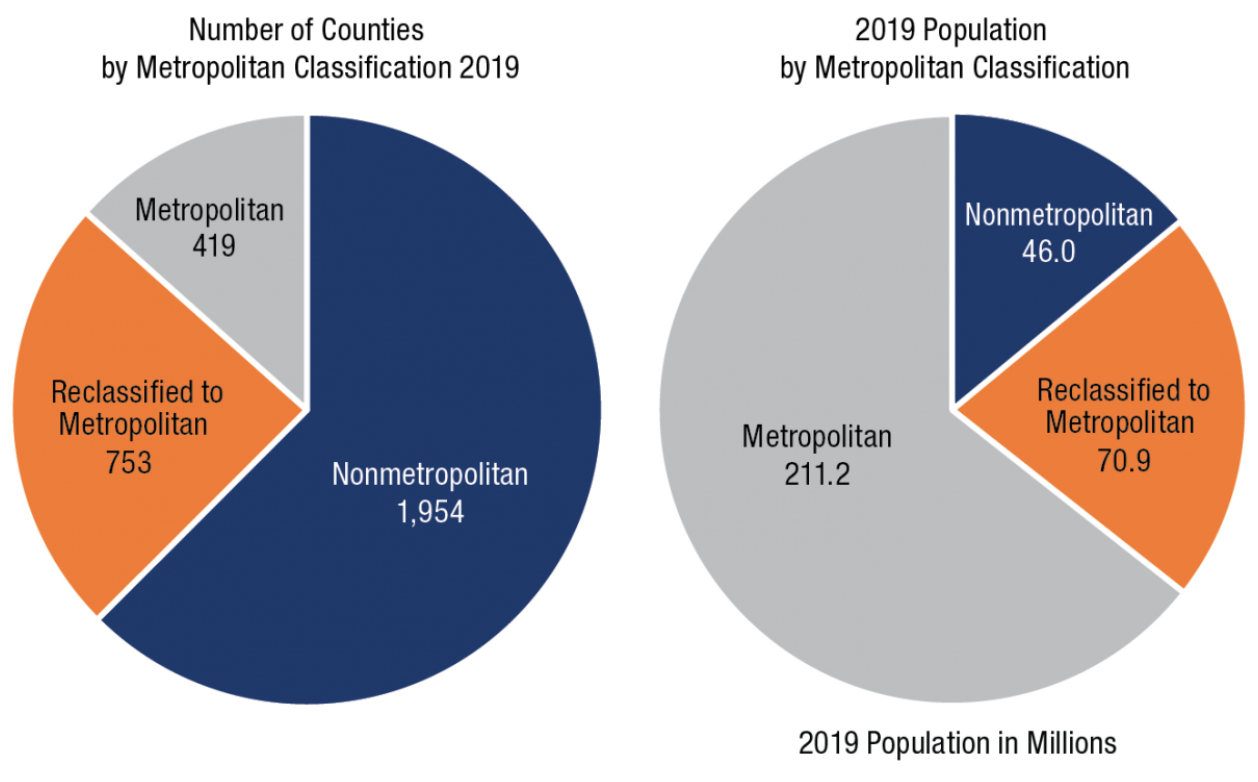
Source: K. M. Johnson and D. T. Lichter, Demography (2020). Updated to July, 2019, using Census Bureau Estimates.
Figure 3. Population Change by Decade Between 1970 and 2019 by Metropolitan Classification
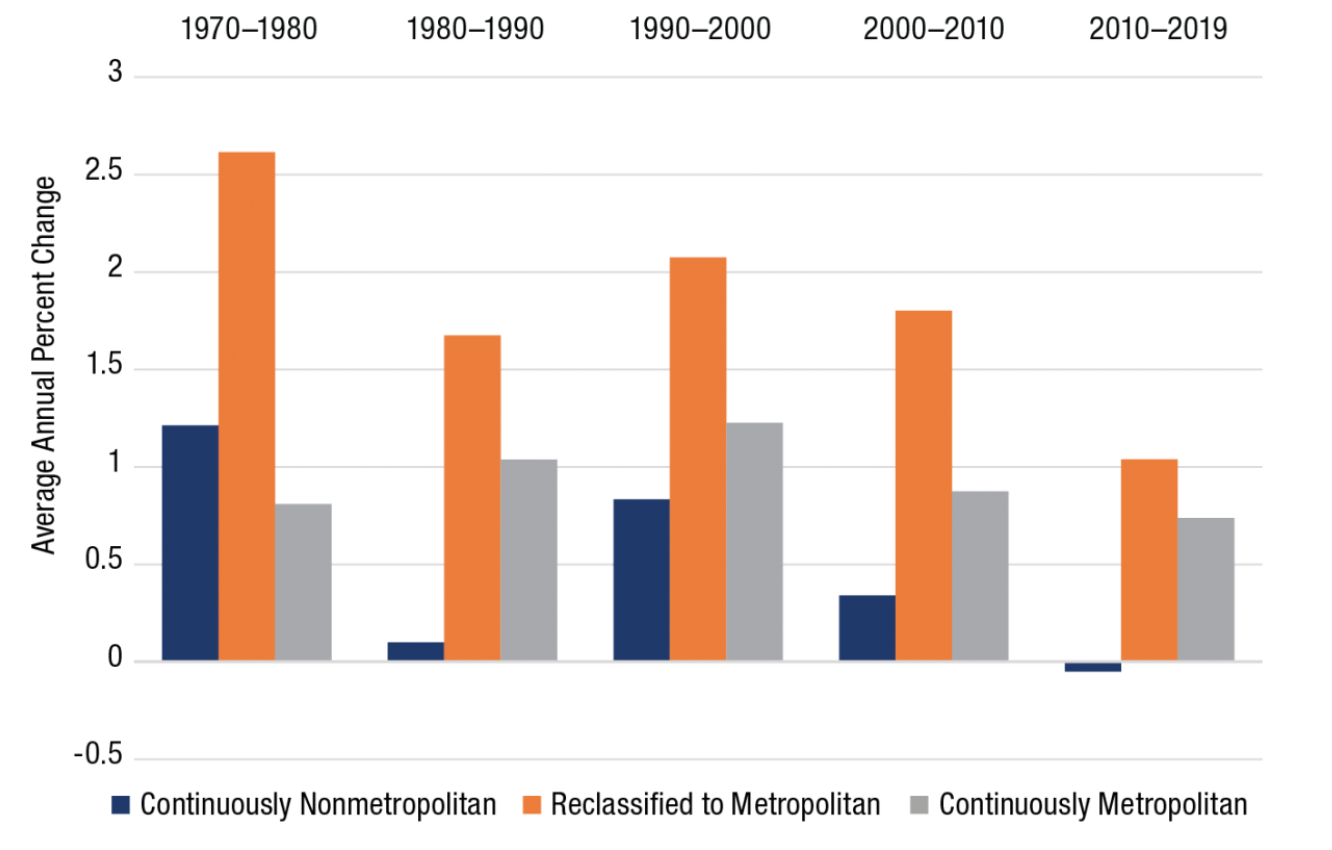
Source: K. M. Johnson and D. T. Lichter, Demography (2020). Updated to July, 2019, using Census Bureau Estimates.
The Nonmetropolitan Demographic Paradox
The ongoing “metropolitanization” of America through reclassification is a demographic paradox—one not often appreciated by policymakers, the media, or researchers. It is a tale of two rural Americas. One includes many of the demographic winners—nonmetropolitan counties with a history of and potential for population growth and economic development that have been siphoned off, decade after decade, into metropolitan areas, along with some remaining nonmetropolitan counties—especially those proximate to metropolitan areas or with appeal to amenity or lifestyle migrants—that continue to gain population and prosper. But in the other rural America are many counties with limited potential for future growth, especially those in remote and isolated rural areas that depend on agriculture and low-wage manufacturing or service industries. It is these counties that drive the commonplace narrative of chronic rural decline and economic malaise.
The interpretative problems caused by this highly selective reclassification are not limited to population change. Reclassification also affects the usual interpretations of changing levels of rural poverty, population aging, educational quality, and economic growth. For example, nonmetropolitan counties that have transitioned to metropolitan status typically include higher percentages of college-educated people, higher per capita incomes, lower poverty rates, and lower percentages of older people. Over time, the net transfer of education and income reflected in this transition has exacerbated rural-urban disparities in human capital as well as population, adding to the narrative of rural decline.
At a minimum, our results should temper some of the pessimism about the state of rural America. The common narrative of dying rural areas turns out to be a story of rural success as much as anything. Many growing counties are no longer counted as rural, having now joined the universe of metropolitan counties. For urbanizing rural areas, the demographic future looks bright.4 We are much less sanguine about the many remote, thinly populated, and declining areas “left behind” in rural America, where the prospects for future population gain and development seem more limited than ever.
Methods
County population data come from the Censuses of 1970 to 2010 and Census Bureau estimates from 2010 to 2019. Metropolitan areas consist of one or more central counties that contain an urban nucleus of 50,000 or more people, together with any outlying counties that are economically integrated with the core. We divided counties into three groups. The first group includes the 1,954 counties that remained nonmetropolitan throughout the study period. The second includes 419 continuously metropolitan counties. The third group includes the 753 counties that were reclassified from nonmetropolitan to metropolitan during the study period. They are of interest because they represent the transfer of land and population from nonmetropolitan to metropolitan status. The methodology we used is discussed in more detail in our article in Demography.
ENDNOTES
- We use the terms rural and nonmetropolitan as well as metropolitan and urban interchangeably here.
- K.M. Johnson and D.T. Lichter, “Metropolitan Reclassification and the Urbanization of Rural America,” Demography (2020), https://doi.org/10.1007/s13524-020-00912-5.
- A few counties that were metropolitan in a previous decade are redefined as nonmetropolitan later, but the vast majority of the reclassifications in each decade are from nonmetropolitan to metropolitan.
- A. Van Dam, “The Real (Surprisingly Comforting) Reason Rural America Is Doomed to Decline,” Washington Post, May 24, 2019, https://www.washingtonpost.com/business/2019/05/24/real-surprisingly-comforting-reason-rural-america-is-doomed-decline; J. Fallows, “The Rural-Urban Divide Is More Complicated Than You Think,” The Atlantic, May 28, 2019, https://www.theatlantic.com/notes/2019/05/rural-urban-divide-more-complicated-you-think/590326/.
- Johnson and Lichter (2020).
ACKNOWLEDGMENTS
This brief summarizes the authors’ research in K.M. Johnson and D.T. Lichter, “Metropolitan Reclassification and the Urbanization of Rural America,” Demography (2020), https://doi.org/10.1007/s13524-020-00912-5. Kenneth Johnson’s work was supported by his Andrew Carnegie fellowship and by the New Hampshire Agricultural Experiment Station in support of Hatch Multi-State Regional Project W-4001. The opinions presented here are those of the authors and do not necessarily reflect the views of the funding organizations. Barbara Cook of the Carsey School of Public Policy provided geographic information system support.