A Quantitative Analysis of GDP in the Upper Peninsula
The data listed here comes from the Bureau of Economic Analysis (BEA). The BEA is a government agency that focuses on producing economic statistics from the national level down to metropolitan and county areas.
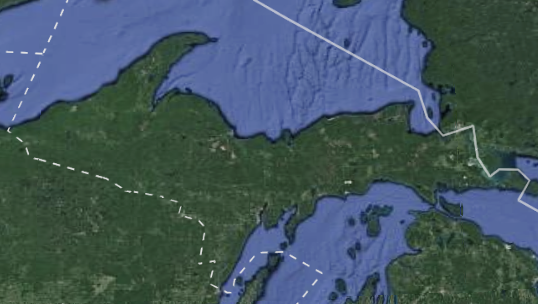
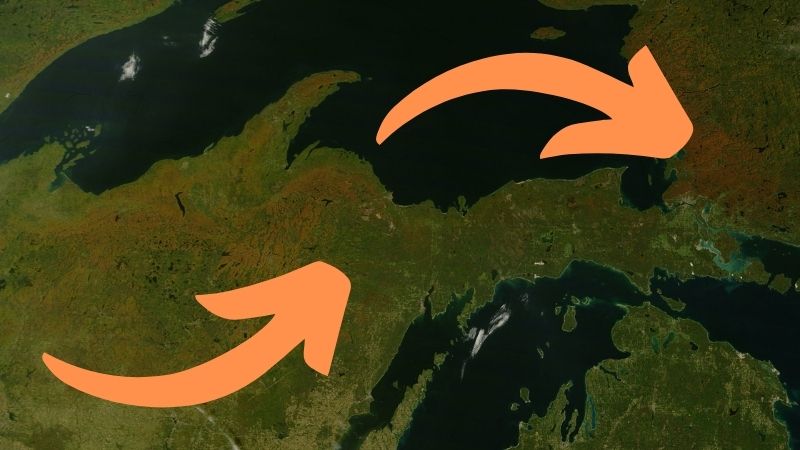
This paper will be looking at the UP–specifically at individual industries that make up its economy. Along with the quantitative look at industries, there will also be a focus on individual counties and what they proportionally (based on the population) contribute to the overall Gross Domestic Product (GDP).
One last factor being looked at is the Compound Average Growth Rates (CAGRs) of specific industries and counties. Which provides, in part, a gauge of the overall structure of the economy now, and moving into the future.
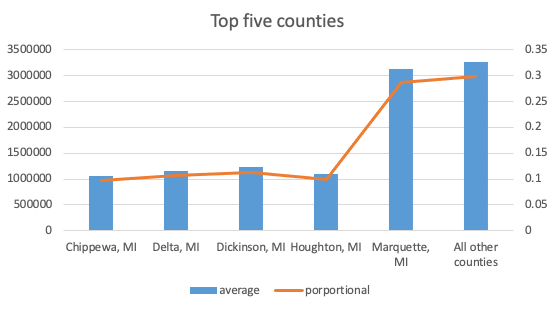
The counties that make up the largest share of GDP for the UP are Marquette, Delta, Dickinson, Chippewa, and Houghton, respectively. Collectively these counties make up about 70.17% of the total economy of the UP1. These five counties are also the top contributors to GDP when you consider them proportionally; however, the rankings do vary slightly2.
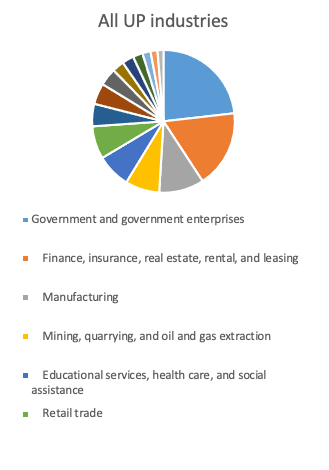
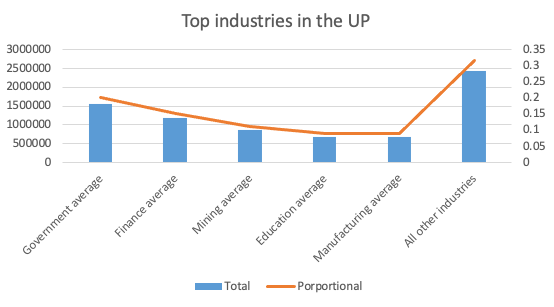
Although the order may be marginally different when looking at the overall makeup, the list does not change dramatically and there appears to be a slight, yet significant decline from the top five to those in the rest of the UP. The top five industries are government and government services (government), real estate, rental, and leasing (real estate)3, manufacturing, mining and quarrying (mining)4, health care, social assistance (health care)5, and retail trade.
The top five counties in the UP have a couple of things in common with each other. The first is that out of their largest industries they share three: government, real estate, and retail trade. Real estate also includes rental and leasing–and leasing (e.g. hotels) seems to provide the largest part of it, pointing to the fact that there is a strong tourism industry in UP6.
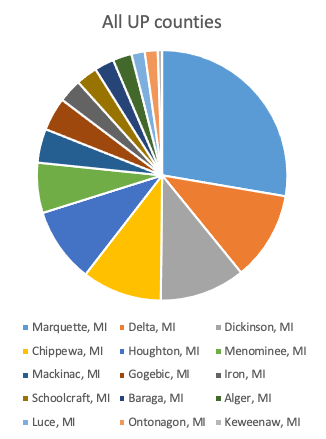
These five counties have a combined GDP of $7,653,330,000 and although this accounts for 70% of the GDP, these counties make up 66% of the population of the UP. This means the five counties have a slightly larger, yet statistically significant, impact on the makeup of the economy than they proportionally should7. Out of these five, Marquette has the largest share, accounting for almost 30% by itself, truly making it a driver of growth across the Upper Peninsula.
Although Marquette may be the county that contributes the most to GDP (both as a whole and proportionally), it does not mean that the entire UP is dependent on it. There are some strong economies outside of Marquette, wholly and proportionally. Outside the five that have been previously mentioned, some others that do well as a whole are Menominee and Gogebic; and proportionally Mackinaw and Menominee, also have a strong showing. Outside of Marquette many counties have strong economic foundations, and given the right support, they may flourish.
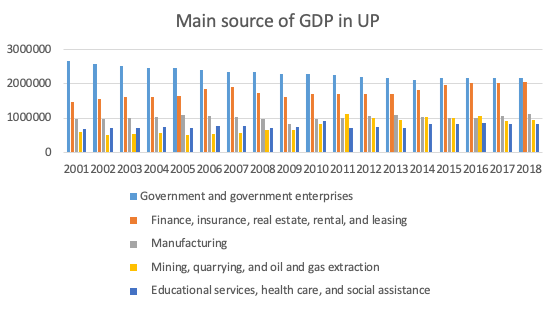
Throughout the UP there are several industries that have done remarkably well both over time and geographically8. These industries are government, real estate, manufacturing, mining, and health care. These industries account for 63.9% of the overall GDP of the UP. One of the most intriguing things about the data being, across the UP, the government has been the biggest provider of GDP; however, its share has been decreasing.
The real estate and leasing market has been flourishing, and since 2001 it has increased by nearly 40%, seeming set to overtake government as the largest industry in the UP. Manufacturing and mining have seen some slow, yet steady growth rates; however these two industries do not seem to be prevalent in the same areas. Along Lake Superior, mining seems to do its best; this is especially true of Marquette where it represents about 26.75% of total GDP. This is most likely to be due to the large quantities of natural mineral deposits found in the northern part of the UP.
In the south-central area of the UP, manufacturing seems to do its best. This appears to be because of the minimal distance to Wisconsin, where manufacturing is prevalent, making it seem that these counties share traits of northern Wisconsin counties. However, in the south-central counties, manufacturing does not represent an outsized portion of the total industry, showing more balanced economies (which tend to do better In the long run).
Although there is no specific industry provided by the BEA that explicitly talks about tourism, there are some signs it has a strong grip on the UP; one of the largest indicators is the real estate industry. Although in many parts of the UP population levels have stayed flat, or even fallen, the real estate and leasing industries have shown consistently large gains. This leads one to believe that outside of providing permanent housing, there is some driver of growth in this sector.
The most plausible explanation is that the short term rental market (and in that most likely hotels and such) provides this growth. The fact that the UP contains minimal trucking routes, and does not tend to have an exorbitant amount of business travels would lead one to believe that tourism is the cause of this growth.
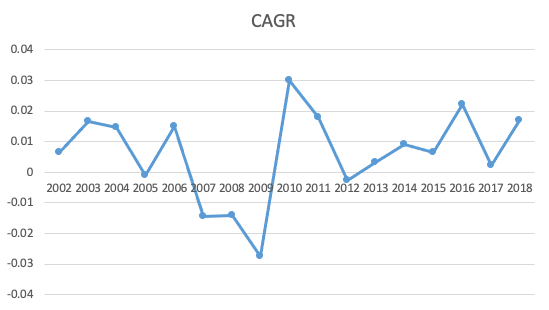
One thing that is looked at is how well the economy as a whole, as well as each particular industry, and county has done since the start of the 2008 recession. This is mainly looking at which industries and counties have done the best over time, using CAGR’s9. Overall, the highest growth area of the economy was mining in Menominee10. Though this is significant in terms of growth–in terms of overall GDP production, it is lacking, making an almost insignificant portion of the overall economy.
In more general terms, the highest-growing industries in the UP are agriculture and mining. The mining industry, while being high growth, also makes up a large portion of the economy. Making it exceedingly impressive and important. Agriculture, on the other hand, has been growing at a consistently high level since 2008 but does not tend to be a large part of counties’ economical makeup. However, as time goes on this steadily-increasing trend may change that.
When referring to counties, there tends to be a lot more variety. This means that no one particular county did significantly better than the rest. The closest there is to a true leader in this category is Mackinac County; as their county-wide GDP increased by an average of 5.7% per year, the highest of the UP. As one might expect, they also had several industries that also maintained a growth rate of over 5%. Two of their highest were their real estate and agriculture, which grew 17.75% and 14.3% per year on average, respectfully.
Overall, there were about 35 times the amount of economies that grew at an average rate of over 5% a year than there were that decreased by a rate of -5% a year. This is a good indicator the UP has done well to support itself after the crash of 2008. It also shows that if these growth rates are kept up, many good things can come to the UP in future years.
Over the past ten years, the UP has shown consistent and steady growth. Since the financial crisis, industries and counties, for the most part, rebounded evenly and consistently–as shown through CAGRs, as well as industry trends. Those that are rising above the typical rate such as construction and arts are more than making up for the losses in government spending.
If the trend continues, it should stay on track with the rest of the United States. These growth rates, coupled with the increase of private industry make it seem the UP is heading in a healthy and sustainable direction.
Notes
1This number was found by taking the average total GDP of each county and dividing it by the overall GDP of all counties. This was done for 2016, 2017, and 2018; the resulting numbers were then averaged to create the average total GDP statistic.
2The order becomes Marquette, Chippewa, Delta, Houghton, and Dickinson
3The full name for this category from the BEA website is finance, insurance, real estate, rental, and leasing, however, the real estate rental and leasing portion makes up over 80% of this.
4Add a bullet here about the full name and how mining is the vast majority of it
5The full name here is Educational services, health care, and social assistance, however, 83% of this comes from the healthcare industry.
6A slight exception to this comes in the form of Marquette where real estate only accounts for 70% of the sector, pointing towards the conclusion that finance may be a growing industry Marquette county
7Though when you remove Marquette these counties seem to be right at the level they should.
8The mining industry has done is pretty much only represented in Marquette, however, it accounts for a large enough share of GPD that it is one of the top industries in the UP
9Compound average growth rates are a measure used to show how much an economy has grown over a period of time; these are especially useful when comparing specific levels of growth the formula for this is CAGR = (Vfinal/Vinitial)1/t-1 (where Vfinal is the final value, and Vinitial is the beginning value, and t is the time in years)
10Average of 22.4% growth per year since 2008
11However, during this period it would almost be better to look at how many industries grew under 0% which there were 55, compared with 35 growing more than 5%.